

Google recently made changes to the way applications like iDashboard need to authorise with Google Analytics causing a period of time where we were unable to collect property statistics.
This change required us to make amendments to how the system collects this analytics information for Property Web Views.
Along with this change to how we fetch this data from Google, we have also made an interface upgrade, providing you with more information than ever before.
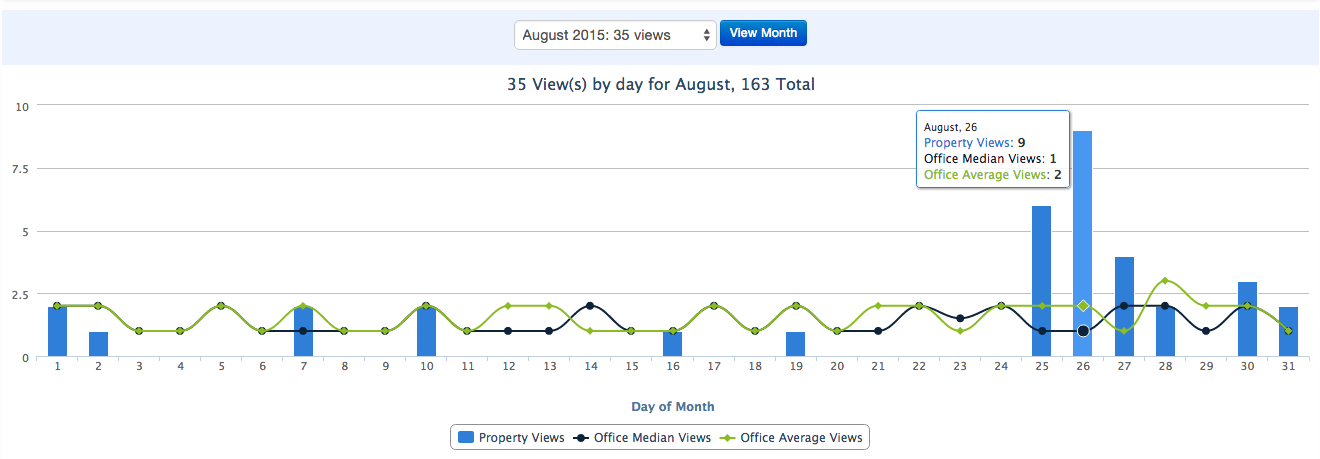
Property Web Views in iDashboard now has an new upgraded chart, which shows the Property Views (aka Hits) along with the Office Median Views and Office Average (aka Mean) Views, which can easily be disabled for each property by simply clicking on the line graph title down the bottom of the graph/chart.
You can obtain more detailed per day information by simply hovering over the date you wish to investigate further.
Median = The Median is the number found at the exact middle of the set of values. This is a more accurate representation of the central tendency value as it is using the middle value.
Average = The Average (or Mean) is calculated adding up all the values and dividing that score by the number of values. The problem with this method is that if you have a value that is unusually high or low, it skews the Average as it is largely influenced by outliner values.
With the activation of the new Google Analytics in iDashboard we have also retrospectively collected your stats for the last couple of months to ensure everything is now up-to-date.